
Python Excel Tutorial with Pandas Library
Using Python Pandas library to READ and Write data in Excel XLSX files
Your programming skills in python sometimes might be needed for making data analysis. In the market lots of people use Excel for manipulating different data starting from simple formulas, going through statistical analysis and finishing into advanced financial spreadsheets.
The python community built beautiful package that helps to analyze Excel xlsx files. The package is named Pandas. You can use it for almost all possible operations that you can imagine in Excel.
In this Python Excel tutorial I will show you in details writing and reading data using Excel and python Panda library. You will never had any problems with Excel.
Installing Pandas in your Python environment
First of all you need to install the Pandas library in your python distribution. If from some reasons you don’t have installed Python I advice you to go through my article about Python installation in windows.
When you are ready with Python you can install Pandas by hitting one command in your command line:
pip install pandas |
If you finish installation you are ready to start next sections with reading and writing data in Python and Excel.
Writing python lists into Excel xlsx file with Pandas
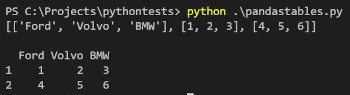
In Python we have some several types of data that we normally use. One of the mostly used data type is list. We will use the small list of cars with generated numbers to show writing the data into Excel spreadsheet in xlsx file.
The example below takes our list of cars and convert it into DateFrame structure that Pandas uses to manipulate data.
import pandas as pd cars = [ ["Ford", "Volvo", "BMW"] , [1 , 2, 3], [4 , 5, 6] ] print(cars) print("") df = pd.DataFrame(cars) print(df) df.to_excel("output.xlsx") |
Finally we call to_excel function on DataFrame object df in order to save the data into Excel spreadsheet. The function takes one parameter the name of excel file. Here we used simple ‘output.xlsx’ name.

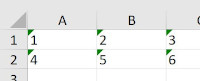
Exactly in the same shape our data are saved into Excel file. Probably this is not the form we would like to have it. It would be fine to be able to format a little bit the name of columns. As always the question is how to do this ?
Adding indexes and headers to Pandas DateFrame object
We need to extract columns names from our data and here goes next package that help us with convertion our list of list into array. The package is numpy so we need to add import numpy as np at the begining of our python script to use the package.
import pandas as pd import numpy as np cars = [ ["Ford", "Volvo", "BMW"] , [1 , 2, 3], [4 , 5, 6] ] print(cars) print("") cars = np.array(cars) data = cars[1:,0:] headers = cars[0] indexes = range(1,3) df = pd.DataFrame(data, index=indexes, columns=headers) print(df) df.to_excel("output.xlsx") |
Now what we have to do some simple operations with our list:
- convert list into numpy array – cars = np.array(cars)
- take all the numerical data without header line – data = cars[1:,0:]
- read header line with car names – headers = cars[0]
- create two indexes using range function to enumarate all the rows – indexes = range(1,3)
Finally we need to deliver all the prepared indexes, headers and data into DateFrame and save the data into excel like in the previous one using the to_excel function.
As a result we have beautifully formatted Excel array with all the data about cars and underlined headers with indexes.

What if we want to remove indexes or headers and paste only some data into Excel spreadsheet ? Is it possible ?
Removing indexes and column names in Excel xlsx file
Removing indexes for our rows or columns names is the simplest part of playing with data in Python using Pandas library. The key is to add two new parameters into to_excel function:
df.to_excel("output.xlsx", header=False, index=False) |
The parameters are header and index and both of them are as default set to value True. When you set them all into False as a result you should have this final result in Excel:
As you can see Pandas package is very elastic in usage and you can do almost everything what you may need with data and Excel.
Write DateFrame to one or more specific Excel sheets
What if we want to save data to a specific Excel sheet ? In all cases that we have did up to the moment we wrote data into default sheet created with Excel file.
The answer is very simple we need to add additional parameter my_sheet_name into to_excel function that specifies the Excel sheet name:
df.to_excel("output.xlsx", 'my_sheet_name', header=False, index=False) |
This will save all your data into my_sheet_name Excel sheet. Here at this point you can ask how to write the data into two different sheets ?
Probably you would like to run such a code that solve the problem:
import pandas as pd import numpy as np cars = [ ["Ford", "Volvo", "BMW"] , [1 , 2, 3], [4 , 5, 6] ] print(cars) print("") cars = np.array(cars) data = cars[1:,0:] headers = cars[0] indexes = range(1,3) df = pd.DataFrame(data, index=indexes, columns=headers) print(df) df.to_excel("output.xlsx", sheet_name ='mysheet1', header=False, index=False) df.to_excel("output.xlsx", sheet_name = 'mysheet2', header=False, index=False) |
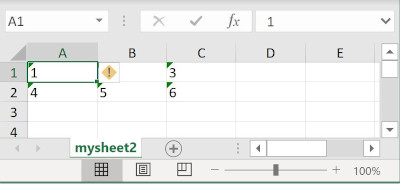
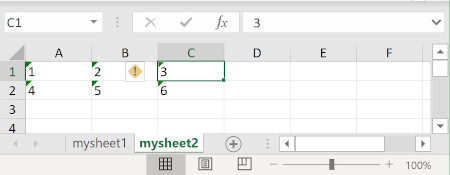
Technically the code looks good but you will get only the last save Excel sheet. The to_excel function just overwrite the existing file with the latest data.
This is definitely something different than what we expected. The solution is to use new excel writer object that will save data into two different sheets and the same Excel file. Here is improved code that saves correctly two Excel sheets:
import pandas as pd import numpy as np cars = [ ["Ford", "Volvo", "BMW"] , [1 , 2, 3], [4 , 5, 6] ] print(cars) print("") cars = np.array(cars) data = cars[1:,0:] headers = cars[0] indexes = range(1,3) df = pd.DataFrame(data, index=indexes, columns=headers) print(df) writer = pd.ExcelWriter('output.xlsx') df.to_excel(writer, sheet_name ='mysheet1', header=False, index=False) df.to_excel(writer, sheet_name = 'mysheet2', header=False, index=False) writer.save() |
There is only one improvement that changes all the rules. We need to pass as a first argument to to_excel function our writer object. This helps DataFrame to keep correct context of final excel file and its spreadsheets.
Note that without calling the save function on writer object the code will not work as we expect. You need to remember to call the save() function
Saving formulas into Excel xlsx file with Pandas
Writing excel formulas using Pandas is very easy task. Similarly to the previous examples we need to keep the whole code like it is. The only difference is to add any excel formula into one of position of list of lists.
import pandas as pd import numpy as np cars = [ ["Ford", "Volvo", "BMW"] , ['=B1+C1+1' , 2, 3], [4 , 5, 6] ] print(cars) print("") cars = np.array(cars) data = cars[1:,0:] headers = cars[0] indexes = range(1,3) df = pd.DataFrame(data, index=indexes, columns=headers) print(df) writer = pd.ExcelWriter('output.xlsx') df.to_excel(writer, sheet_name ='myformulas') writer.save() |
As you can see I added formula B1+C1+1 into to first element of the first list. This will generate what we exactly want. Let’s have a look into excel spreadsheet to see the result:

You can modify the typed formula into any kind of formulas that excel enables. You don’t have any limitations. Only your imagination can limit you 🙂
Adding charts into Excel xlsx file with Pandas
You have introduced into different ways of saving data into Excel spreadsheet. It is high time to use the data and translate them into something that Excel gives you out of the box. The key thing is charts in Excel.
Using Pandas you can with ease add any type of charts with all options you can normally setup working with Excel spreadsheet. So let’s start from typing the code as below. We will analyze every interesting lines step by step.
import pandas as pd import numpy as np cars = [ ["Ford", "Volvo", "BMW"] , [1, 2, 3], [4 , 5, 6] ] print(cars) print("") cars = np.array(cars) data = cars[1:,0:] headers = cars[0] indexes = np.array([ 'Q1', 'Q2']) df = pd.DataFrame(data, index=indexes, columns=headers) print(df) writer = pd.ExcelWriter('output.xlsx') df.to_excel(writer, sheet_name ='myplots', header=True, index=True) # Access the XlsxWriter workbook and worksheet objects from the dataframe. workbook = writer.book worksheet = writer.sheets['myplots'] # Create a chart object with selected type i.e. 'column', 'line' etc. chart = workbook.add_chart({'type': 'column'}) # Adding series for every car type for every quarter chart.add_series({ 'name': '=myplots!B1', 'categories': '=myplots!A2:A3', 'values': '=myplots!B2:B3', }) chart.add_series({ 'name': '=myplots!C1', 'categories': '=myplots!A2:A3', 'values': '=myplots!C2:C3', }) chart.add_series({ 'name': '=myplots!D1', 'categories': '=myplots!A2:A3', 'values': '=myplots!D2:D3', }) # Configure names for horizontal and vertical axes in the chart. chart.set_x_axis({'name': 'Index'}) chart.set_y_axis({'name': 'Value', 'major_gridlines': {'visible': False}}) # Insert the chart into the worksheet in D8 cell worksheet.insert_chart('D8', chart) writer.save() |
The beginning of the code is nearly the same like in the whole this post so we start with setting data for cars. The only difference is that I changed the rows names from enumerated into name of quarters:
indexes = np.array([ 'Q1', 'Q2']) |
Second interesting step is to create chart for concrete spreadsheet. Here we could parametrize the spreadsheet name and assign into variable. I avoided it because I wanted to show in a clear way all the names used in Excel.
workbook = writer.book worksheet = writer.sheets['myplots'] # Create a chart object with selected type i.e. 'column', 'line' etc. chart = workbook.add_chart({'type': 'column'}) |
In the short example I used column type for chart but you can use lots of other types normally available in Excel. More about Excel chart types you can read here: https://xlsxwriter.readthedocs.io/working_with_charts.html .
In the next step but not the last we can add series of data. Here we have possibility to set options like:
- plot name in name field
- name for x axis of our data in category field
- name for y axis in values field
chart.add_series({ 'name': '=myplots!B1', 'categories': '=myplots!A2:A3', 'values': '=myplots!B2:B3', }) |
In the above code we just use standard Excel’s notation to get access to any range of rows of columns. Nothing new for anybody that normally uses Excel as a tool.
The last steps in the code help us to define names for horizontal and vertical axes, store the chart into concrete cell and save the Excel object to save all the data.
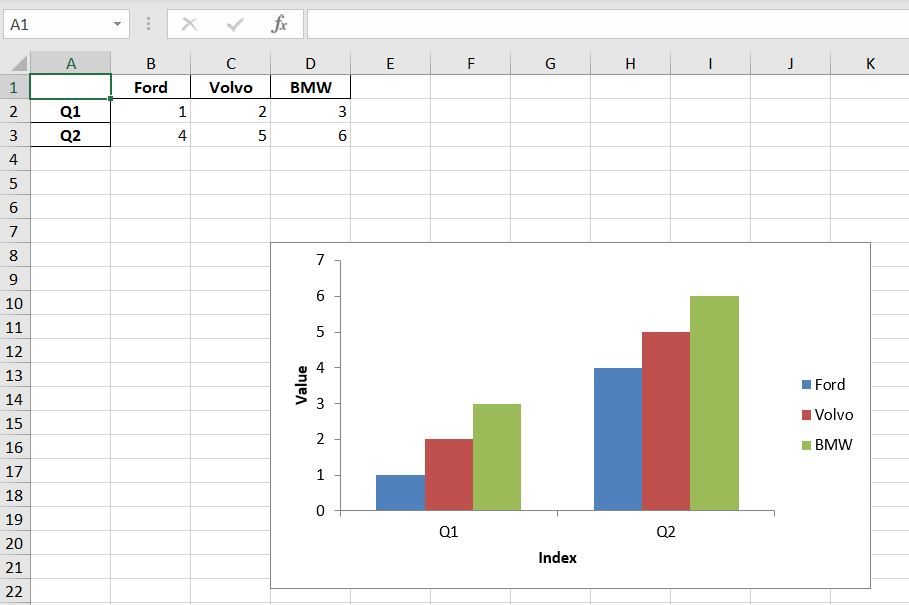
So we made all this job and finally we will receive this as a result:

Definitely something went wrong. The question is what? In all the previous sections I especially avoided the fact that the data saved to Excel by the pandas library are transferred into Excel as a text.
You can observe this small triangles in the top left side of every cell with numerical data. In this manner Excel informs us that the data looks like numerical but are saved as a text.
And this is the cause why our chart missed the data. We can improve our code with changing one line when we create writer object of Excel instance. You only need to add option to save all the data that looks like numbers as numbers:
writer = pd.ExcelWriter('output.xlsx', options={'strings_to_numbers': True} ) |
This small modification makes big change and finally we can see the correct version of the chart with cars statistics:
Activity with charts was the last one the should help you build basic skill for writing data into Excel sheets. Next paragraphs will show you all what we did from the other side. Now we want to read existing Excel files.
Reading table from Excel sheet using Pandas
In all our activities with reading Excel with Pandas I will use the lastly generated output.xlsx files with charts. If you missed it you can generate the file using the code from previous section.
Let’s start from the code that without any additional parameters that reads Excel file as it is:
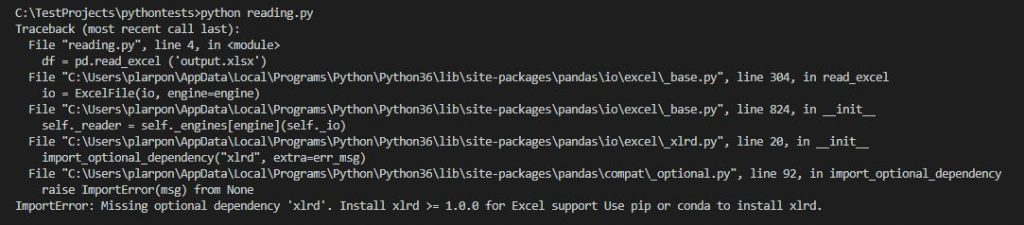
import pandas as pd import numpy as np df = pd.read_excel ('output.xlsx') print (df) |
In this place you should expect that the code will display small array with car sales information and you are right. But when you run this code your first time you may find the problem with missing ‘xlrd’ dependency for Pandas for reading Excel sheets.
You can solve the problem installing missed module with the pip command:
pip install xlrd |
After this small improvement, you should receive what you wanted:
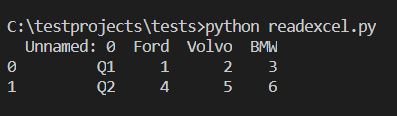
As you can see Python Pandas added indexes to read rows starting from 0 index. This is the standard behavior of the library.