Effective running and debugging python scripts in Visual Studio Code
Brief introduction into Visual Studio Code for python
Starting your journey with programming in any languages requires you to have good and intuitive programming environment. This tutorial explains you how you can configure Visual Studio Code for running and debugging scripts in python.
Effective usage of VS Code gives you in your daily activities better productivity results, learning more effective coding skills.

This is why you need to train and test different options. Don’t hesitate to crash the code or change any options. This is normal way how we gain knowledge in anything and especially in programming.
I believe that you have installed Visual Studio Code on your local machine. If not you can still do this by visiting my previous post about Visual Studio installation process. I explained there step by step downloading and installation.
Working with folders and workspaces in VS Code
Before we run any script in python we need to understand how to play with folders and workspaces in Visual Studio Code.
Generally speaking when you create scripts, application or any program you need to save it somewhere. Here you can do this with two possible ways:
- save files with subfolders into one main directory
- save files and subfolders in workspace
What is the difference between the two possible ways ? For now lets remember that workspaces keeps some additional settings for your root folder that you keep all your files.
In many other type of programming environments you can have alternative names for workspaces like: projects, solutions.
We will work with Visual Studio Code using simple folders because in many cases even in small projects that you will create this will be enough strategy.
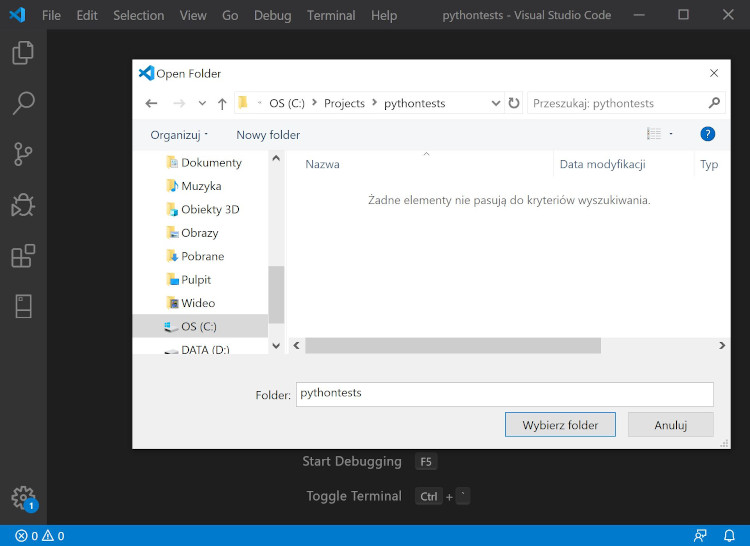
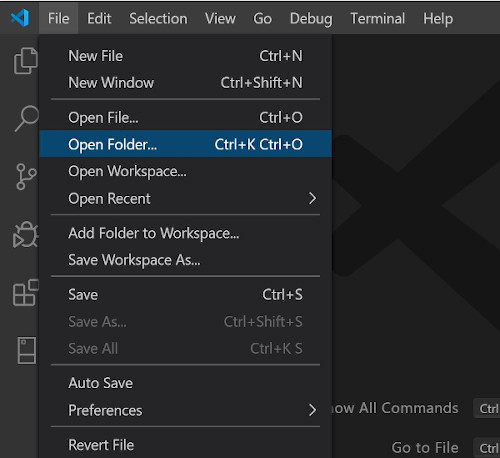
Let’s click in the main menu File -> Open Folder. This will open standard operating system window with folder selection. I prepared the folder with name pythontest. Let’s do it the same and accept the selection.
Using left menu in Visual Studio Code
Visual Studio Code is so easy in using because people from Microsoft designed it in a best possible way. All important options that programmers use very often are available on top.
These top options that you will use mostly are available in left main menu:

 explorer option – every time you want to go to the view with list of files and folder you will use the option
 search option – working with huge number of files in many subfolders may be effective only if you can easily search
 source control – working with code is associated with maintaining multiple versions; Visual Studio Code helps you to work with code using Git for versioning purposes
 run and debug – this option is what we want to use the most especially when something is broken in a code
 extensions – probably is the why visual studio code is the most powerfull environment for programmers; lots of extension available for free you can download with some seconds
 sql server – usage of the option is very handy when you want to connect to sql server database and configure a connection with some clicks
We will use some of the presented options later in the article. Let’s remember that your starting view and mostly used option will be Explorer option. Using it you can always go back to the list of files.
Running our first Python script
I understand you. You probably ask now when do we start coding ? I am also so excited but there is no other way than going step by step through the basics.
Before we run first python script let’s verify also that you have installed python in your operating system and that you have set up correctly environment PATH. All these you can do using my article about installing python.
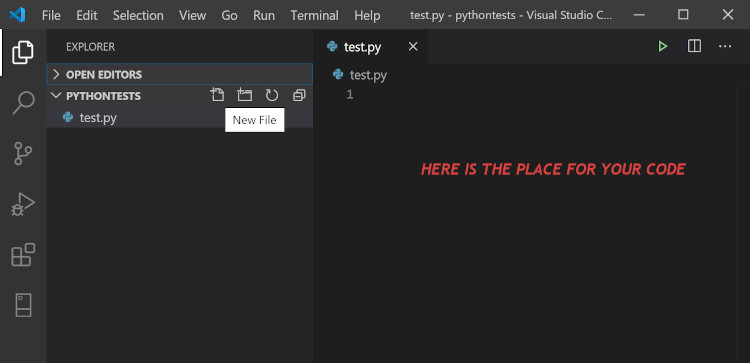
Click New file in the section Explorer option and type the name of your first python script for example test.py. In the right side you can see the content of newly created file.
Type the below content into test.py script:
def Add2Numbers(a,b): c = a + b return c var1 = 10 var2 = 20 var3 = Add2Numbers(var1,var2) print(var3) |
We prepared the first python script for running and you can ask a question how to run it? The answer is very simple we need to run terminal in Visual Studio Code.
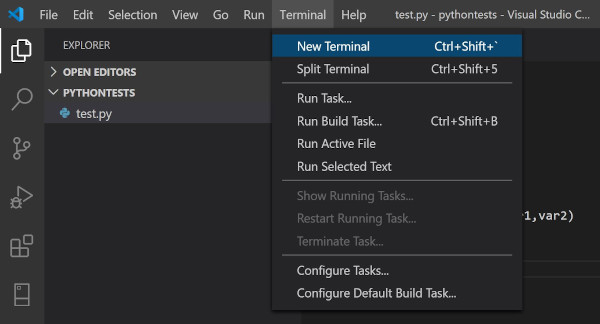
Select from the main menu position Terminal -> New Terminal and you should see new terminal window at the bottom side of Visual Studio Code.
Hit the command python test.py and see the results in the terminal.

You should see as a result number 30 that was counted by the function Add2Numbers in the script you copied and pasted into test.py.
So as you see running script in python is very simple task and it takes seconds to do this.
Debugging and type of errors
According to wikipedia the debugging definition is as follow:
“Debugging is the process of finding and resolving defects or problems within a computer program that prevent correct operation of computer software or a system.”
In other words debugging is about finding weak points in your code that generates errors or generally speaking improper working of our program.
We can point two main different type of errors:
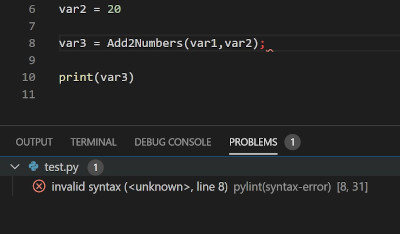
- syntax errors – at the beginning of your programming career this type of error will happen to you most often; in most cases you don’t use programming language syntax properly because you still learn the language
- runtime errors – this errors occurs because you wrote the code correctly from the syntax language perspective but you made logical mistakes that might cause memory leak, program crashes, infinite tasks etc
Debugging python scripts in Visual Studio Code
Runtime errors are the type of errors that I would like to show you how to diagnose. As the name explains the errors occur during running our programs. How we can find them ?
Visual Studio Code like many other programming environments gives us standard set of debugging tools and icons for analyzing code. All of them you can find in the main menu under the Go -> Start Debugging position.
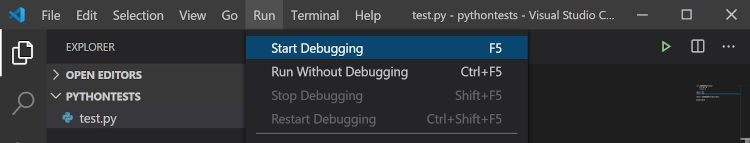
Let’s start debugging python script with hitting F5 (remember this shortcut, in many programming environments runs debugging). As a result you should see only the value printed in the terminal.

You may be asked also about selecting correct debugging configuration. Let’s select from the list Python File.
Setting breakpoints in the code
Debugging means in many cases is like looking for incorrect working of a code. How to do it ? You can do it by observation of different variables and results from the functions.
In order to start debugging with this better observation we need to hit some breakpoints in our code. You can do this in two different ways:
- put the mouse cursor in the line that you are interested and go to the main main and click Run -> Toggle Breakpoint or hit F9
- in the left margin of your code click left mouse near by the line that you want to observe
Breakpoints in Visual Studio Code looks like small red dots.
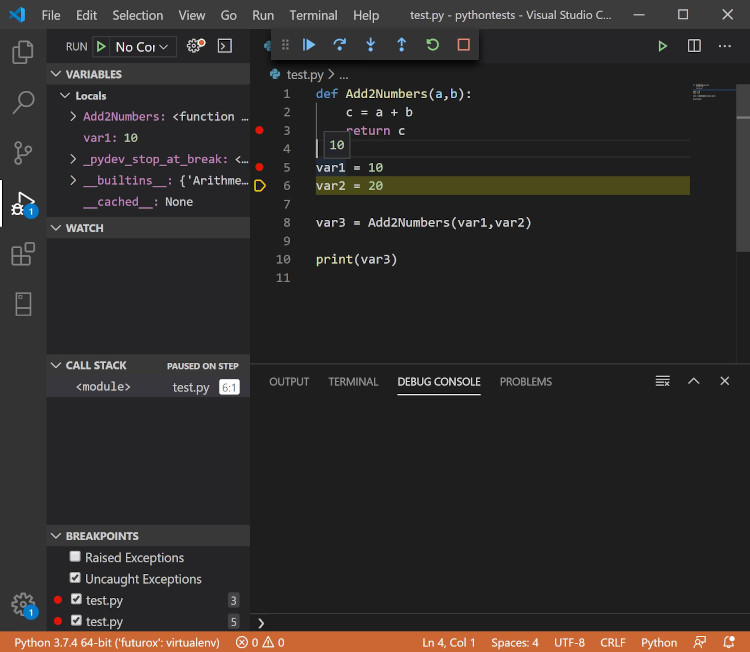
When you run the code again you will see that program stops in the line where breakpoint is set. You can move your mouse cursor over the variable name in order to see the current content of the variable.
Looks that you know how to set breakpoints but still you don’t know how to walk through different lines of code and spy current variables. There is also lots of different new windows displayed. In next sections I will explain you step by step all of them.
Here is the list of windows we need to analyze:
- debugging with navigation panel
- variables window
- watch window
- breakpoints window
- call stack window
- debug console window
All of them are very important in detecting bugs in your code and effectively verify the correctness of implemented algorithms.
Debugging with navigation panel in VS Code
This is section is a basic of basics. You need to control every program using the commands that I explain you in a moment. What is worth to say that when you learn the commands you will probably use the shortcuts more than buttons.
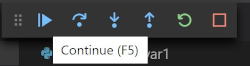
When you start debugging and the program will stop in your first breakpoint you should see debugging navigation panel. Let’s go through all the options:

 continue button helps you always when you want to go to the end of program or to the next breakpoint (run it using F5)
 step over button is usefull when you want to go through the code line by line but without going deeper into nested parts of code (besides the situation that other breakpoints are set in nested code); this is mostly used debugging option (run it using F10)
 you want to use step into option when you debug your code and want to go into nested level for example into the code of function that you are interested in; normally your debugger wants to go over the details of your called function into the next line of code (run it using F11)
 when you are inside the code of function and you want to go back to the place where the function was called (one level up) you will use step up option (run it using Shift+F11)
 from time to time you may have the situation that you went to fast to the next line and you would like to repeat debugging again, this is exactly when repeat button can help you (run it using Ctrl+Shift+F5)
 stop option is very handy especially when you verified what you wanted during debugging process and you are no more interested to analyze the code, you just want to stop it (run it using Shift+F5)
Being proficient in debugging basically comes down to mastering the above commands and their shortcuts by training and training.
Of course live would be too easy if you learnt only the options. In the next section you will see other very interesting windows that can help you diagnose any python code in debugging process.
Observing python variables in debugging
Technically observing variables, values returned by functions and other models is what we want to analyze in our python code. The possibility to verify our code from the logical point of view is the most important in the whole debugging process.

How can we look into the current value the selected part of the code ? We have two options:
- simple observing – just move your mouse cursor over the constant, variable and you should see the current content; this activity is possible when you are in the scope of currently analyzed code and debugger go through the code step by step (look command above from the previous section)
- advanced observing – you want to be able not only to see value of currently observed variable but you may also want to see results from other variable and values returned by the function calls
Watch window for debugging python code in VS Code
I like to use the watch window the most like a calculator. You can focus on analysis of your code and from time to time to verify something you go to the watch window and type interesting you expression.
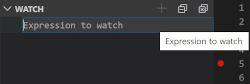
We can type different type of expression starting from simple mathematical formula like 2+2, going through variables or function calls with parameters that we want to verify.
You can even type as parameters other functions with their own parameters. Look below how Visual Studio Code shows different type of expression from Python language:
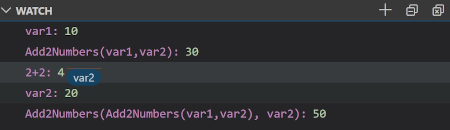
At this point it is worth to say that you can change the order of the expressions you typed in Watch window exactly like you want.
Visual Studio Code helps us also to save the list of typed expressions even if we restart the whole programming environment. It is additional benefit from using VS Code.
Breakpoint window to stop python code in debugging
One of the last windows that we review is the Breakpoint window. This is the source of knowledge for us to verify all the places where we setup up breakpoints in python scripts.
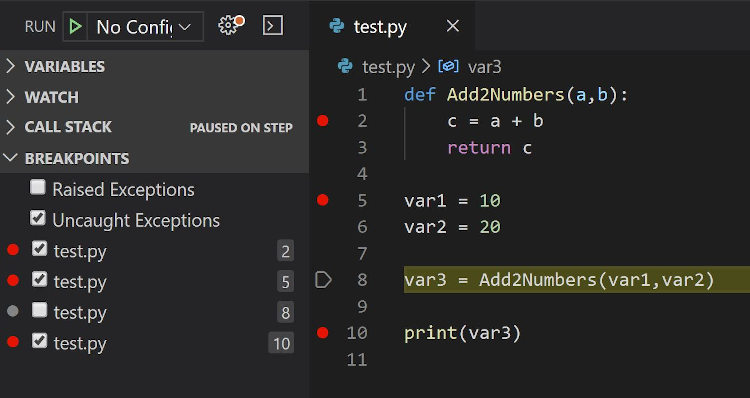
In the window we have detailed information about the script file name and number of line with breakpoint.
You can also set checkboxes with Raised Exceptions and Uncaught Exceptions. In both cases you will be able to find your fault code that generates unwanted exceptions. This is very handy functionality.
So instead of walking through the scripts with code using general code explorer you can use also Breakpoint window but for breakpoints points in the code that you are mostly interested.
Call stack window in VS Code
Sometimes you may want to have the knowledge about the variables that from the current debugging context are not available. For example going back to our sample code:
def Add2Numbers(a,b): c = a + b return c var1 = 10 var2 = 20 var3 = Add2Numbers(var1,var2) print(var3) |
let’s imagine that you are with debugging inside the function Add2Numbers in return line and you want to know the value for variable var1.
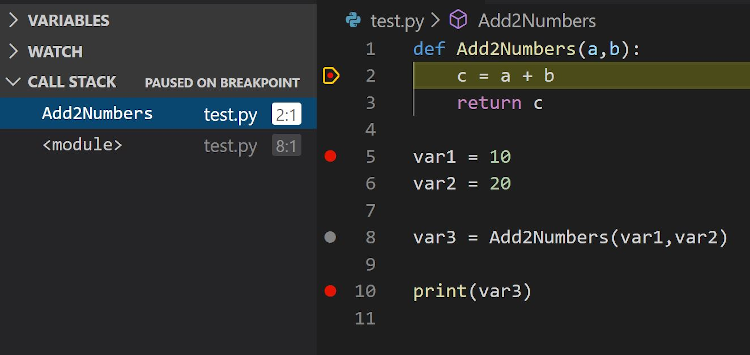
Using call stack window it is possible to do this. You need to click to higher level of code in the call stack list and then preview the value of var1 variable using watch window or console window.
Another use case you may want to use call stack window for debugging python code is to find the place from where the function was called.
In our case function Add2Number is called only from one place but you can have situation that the function will be called from hundreds scripts (library function).
Using console debug window to preview python code
The last window I would like to show you is the console debug window. The window is a little similar to the watch window but the difference is that we don’t have option to save our expressions.

Try to test different expression like you can see in the screenshot. Type them in the bottom line with active cursor:
- a – you should get an error because there is no definition for ‘a’
- var2 – returns 20
- Add2Numbers(var1,var2) – returns 30
- Add2Nubers(var1,10) – returns 20
- var1 -1 – returns 9
You debugging skills in Python with Visual Studio Code
After this short article you should be able to use all the most important parts of Visual Studio Code for debugging efficiently python code. Remember this is just the beginning of the journey.
Only hard training different variants and writing code may help you to stay better in coding and using the debugging options.
So test your ideas in python. Test your code and enjoy 🙂


I don’t typically comment on posts, but as a long
time reader I thought I’d drop in and wish you all the best during these troubling times.
From all of us at Royal CBD, I hope you stay well with the COVID19 pandemic
progressing at an alarming rate.
Justin Hamilton
Royal CBD
Thank you Justin. Keep in good health too.